


The PJenga Framework by
Ike Aaren Hadler -
5. March 2026
Monitoring systemic stability
Understanding complex systems requires more than identifying isolated events.
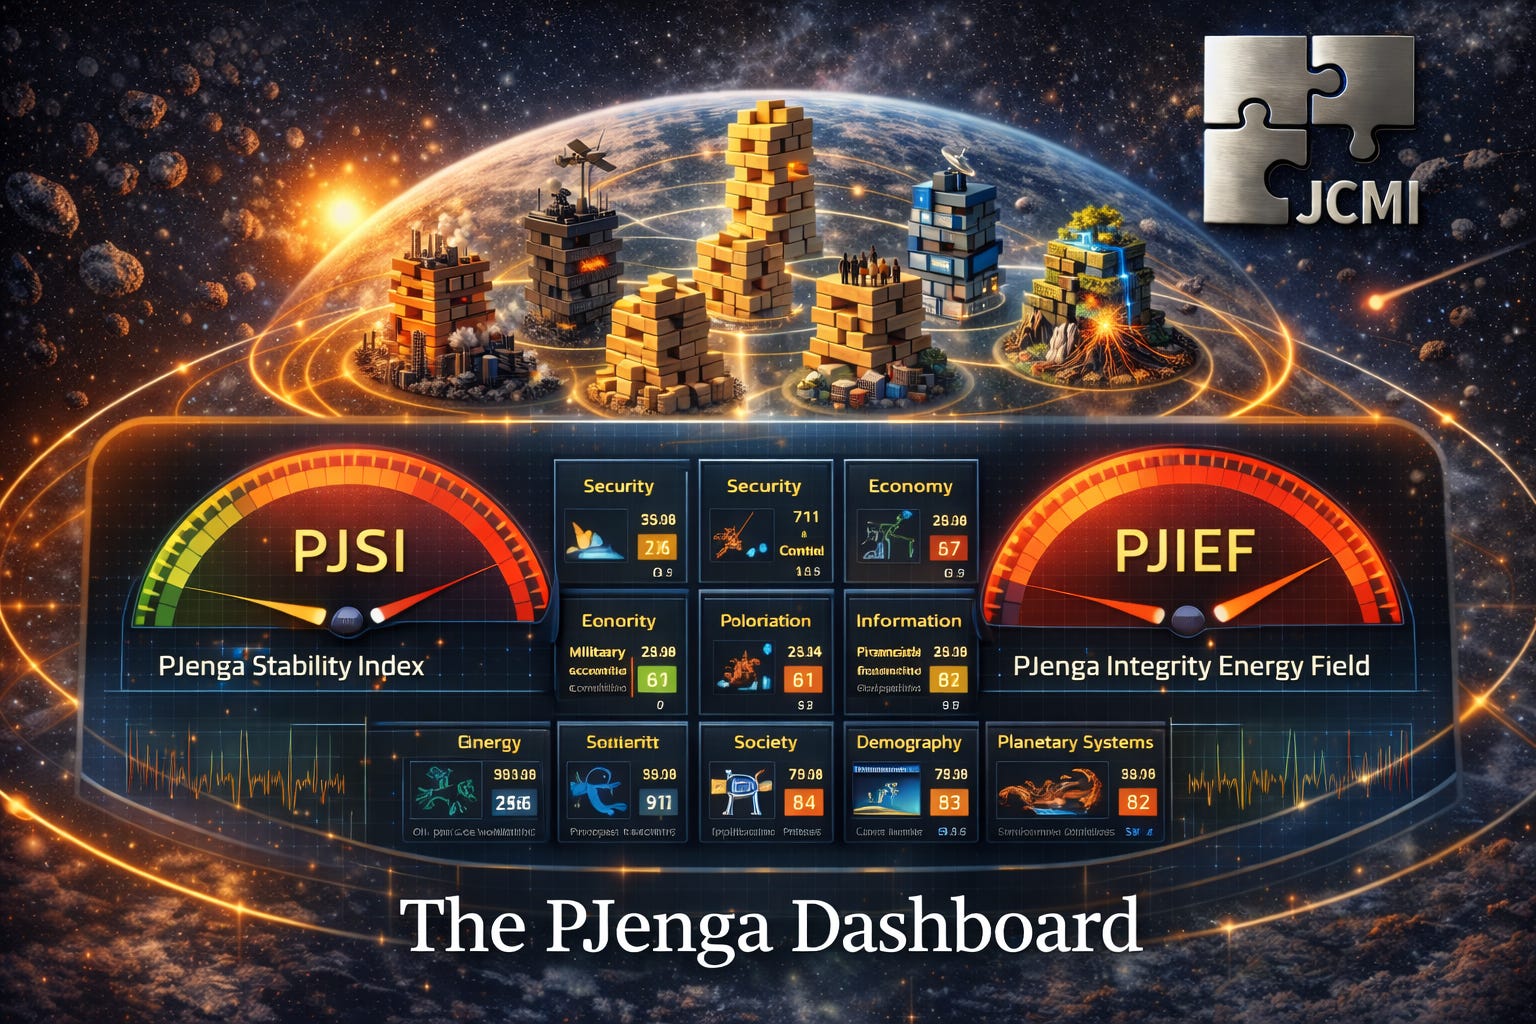
The PJenga Framework therefore introduces a conceptual monitoring interface: the PJenga Dashboard (PJD).
The dashboard visualizes the condition of each structural tower and the tensions between them.
Instead of asking whether a crisis has occurred, the dashboard asks:
How much structural tension currently exists within the system?
⸻
The PJenga Stability Index (PJSI)
The PJenga Stability Index represents an aggregated measure of global system stability.
It reflects how balanced the seven towers currently are.
High stability indicates that stress is distributed and manageable.
Low stability indicates that multiple towers are under simultaneous strain.
⸻
The PJenga Integrity Energy Field (PJIEF)
While the towers represent structural systems, the PJIEF represents the tension field between them.
Economic stress, geopolitical competition, and information conflict create invisible pressure fields that link the towers together.
When stress increases in one tower, the PJIEF transmits that pressure into neighboring systems.
⸻
Reading the dashboard
A simplified PJenga Dashboard might monitor indicators such as:
Energy
• oil price volatility
• supply disruptions
Security
• military escalations
• conflict intensity
Economy
• financial volatility
• trade disruptions
Information
• narrative polarization
• information warfare
Society
• political instability
• protest activity
Demography
• migration pressure
• labor market stress
Planetary systems
• climate anomalies
• environmental disruption.
These indicators do not predict collapse.
But they reveal where the structural stress within the system is increasing.
In a complex world, early signals often appear long before visible crises emerge.
The purpose of the PJenga Dashboard is therefore simple:
to identify where the system is becoming structurally fragile.
Part of the PJenga Framework Series
The PJenga Framework is a systems-analysis model developed by Ike Aaren Hadler.
The following articles explain the structure of the model step by step:
1. Introduction – The PJenga Framework

2. The Seven PJenga Towers – Structural foundations of the system

3. Forces within the PJenga System – Pressure, friction and acceleration

4. The PJenga Dashboard – Monitoring systemic stability

5. Cascades and Domino Effects within the PJenga Framework

6. PJenga Case Study – Hormus: Energy shock and systemic stress

7. PJenga Case Study – Ukraine: Military conflict and structural strain

8. PJenga Case Study – Information War: The destabilization of perception

Part of the PJenga Framework Series
https://jcmi2025.substack.com/p/1-indroduction
https://jcmi2025.substack.com/p/the-seven-pjenga-towers
https://jcmi2025.substack.com/p/3-forces-within-the-pjenga-system
https://jcmi2025.substack.com/p/4-the-pjenga-dashboard
https://jcmi2025.substack.com/p/5-cascades-and-dominoeffects-within
https://jcmi2025.substack.com/p/6-pjenga-case-study-hormus
https://jcmi2025.substack.com/p/7-pjenga-case-study-ukraine
https://jcmi2025.substack.com/p/8-pjenga-case-study-information-war